


Seasonality
Analysis
Use the Seasonality Add-On to analyze the seasonal patterns of any and all asset classes – the seasonality can be calculated for each financial instrument that is available in AgenaTrader.
Description
Seasonality Standard
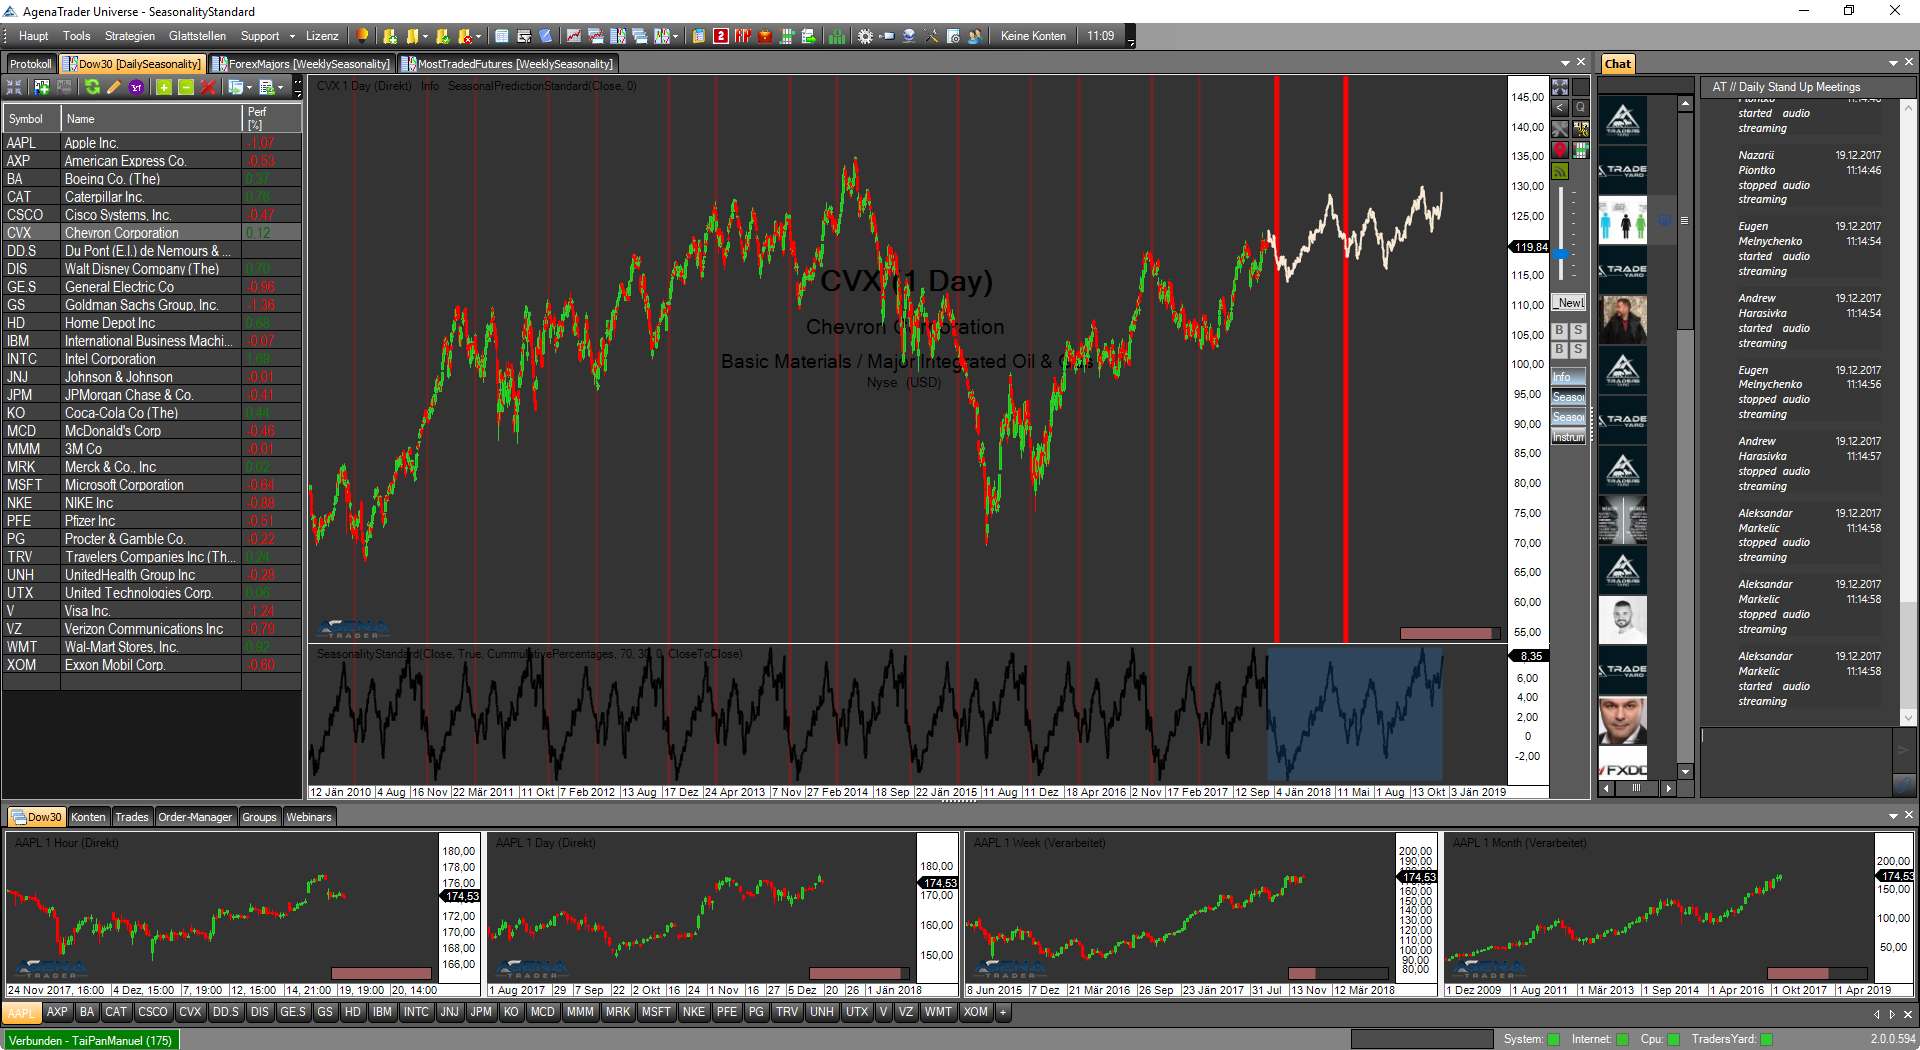
Use the SeasonalityStandard Add-On to analyze the seasonal patterns of End-Of-Day timeframes in all asset classes – the seasonality can be calculated for each financial instrument that is available in AgenaTrader.
- Calculation of the seasonality for every available instrument that your data feed delivers in AgenaTrader (on an EoD basis)
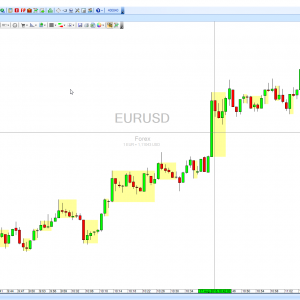
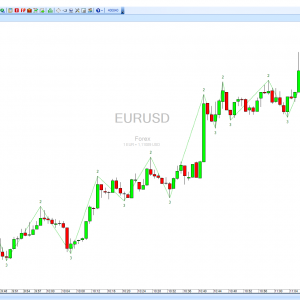
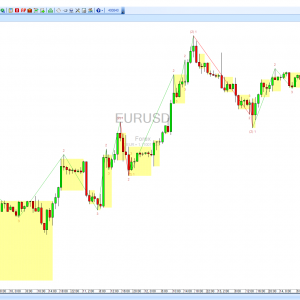
- Identify seasonal run clusters in the chart, where an upward or downward movement can be expected with especially high seasonal probability
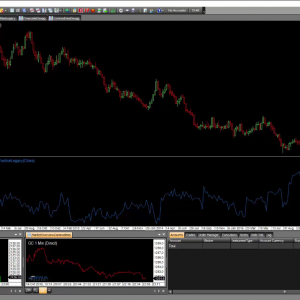
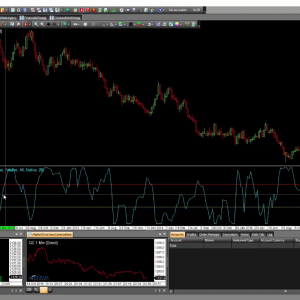
- Innovative display of the predicted seasonal pattern directly in the price chart above the SeasonalityPredictor
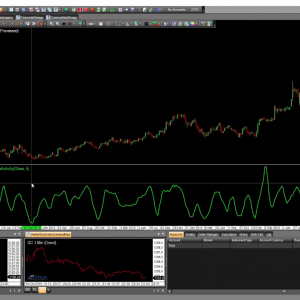
- Detect over- and underperformers using the InstrumentStrength indicator
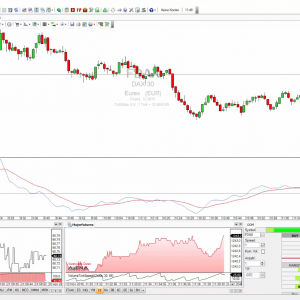
The seasonality indicator calculates the seasonality in all EndOfDay timeframes (e.g. daily, weekly or monthly chart) using the entire history available in the chart. In addition, using the SeasonalityPredictor, you can have the seasonal pattern projected into the future and view it directly in the chart, so as to see at a glance where the value is most likely to move from a statistical point of view.
The InstrumentStrength indicator is an additional helpful tool that provides you with the possibility to compare the performance of up to 30 instruments with each other in order to efficiently search for over- and underperformers and find optimum candidates for seasonality trades.
Read Documentation
Seasonality Institutional
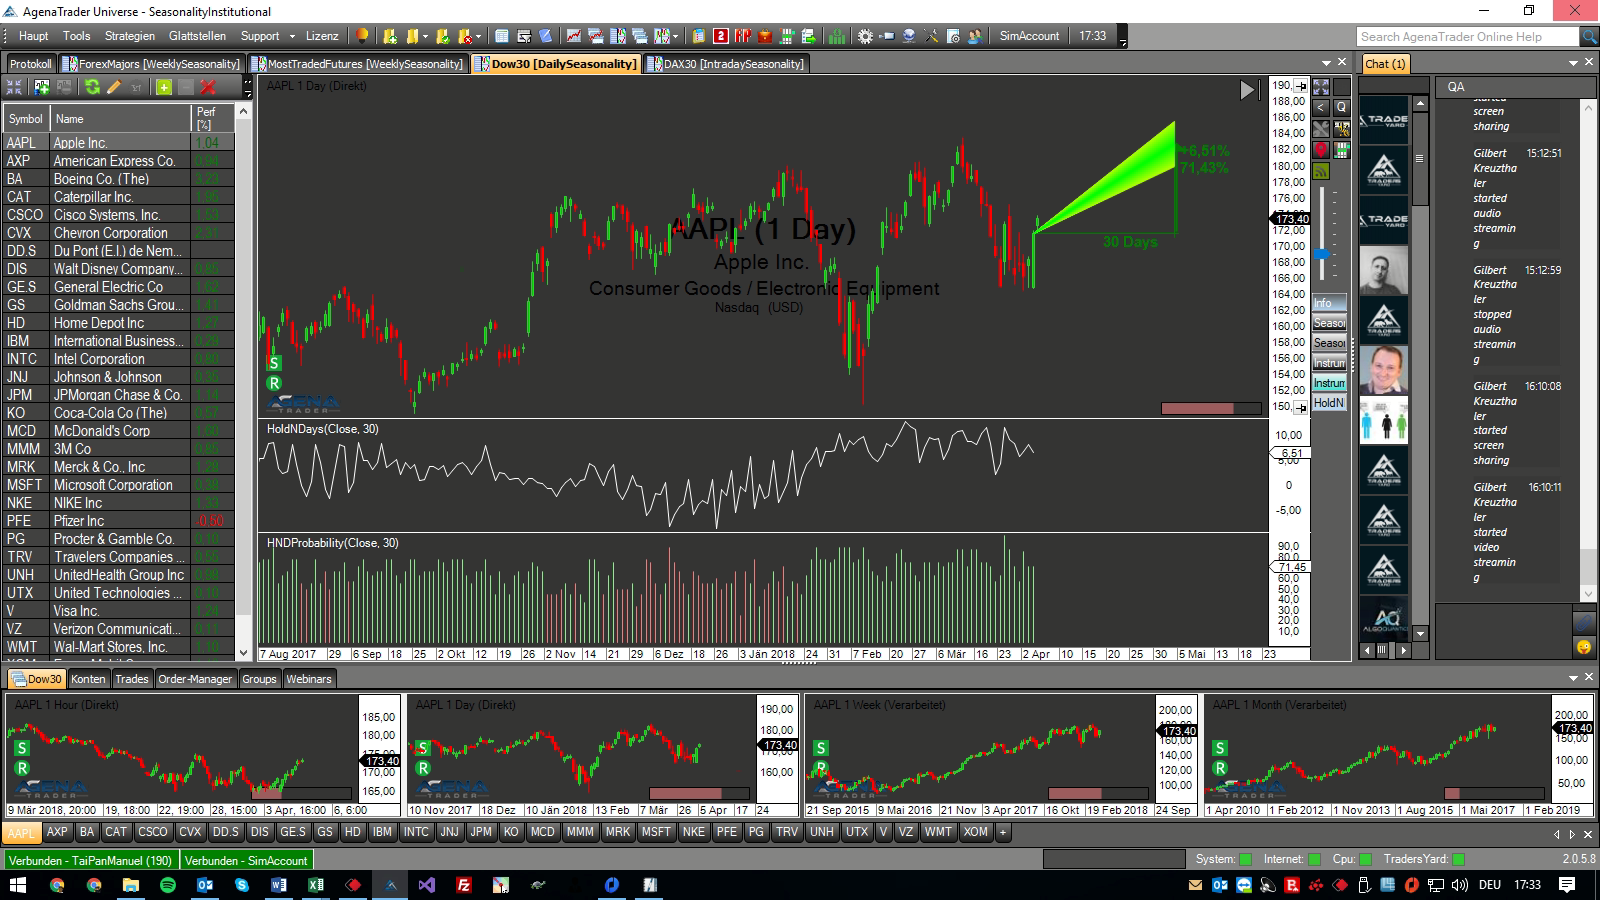
Use the Seasonality Institutional Add-On to analyze the seasonal patterns of any and all asset classes – the seasonality can be calculated for each financial instrument that is available in AgenaTrader.
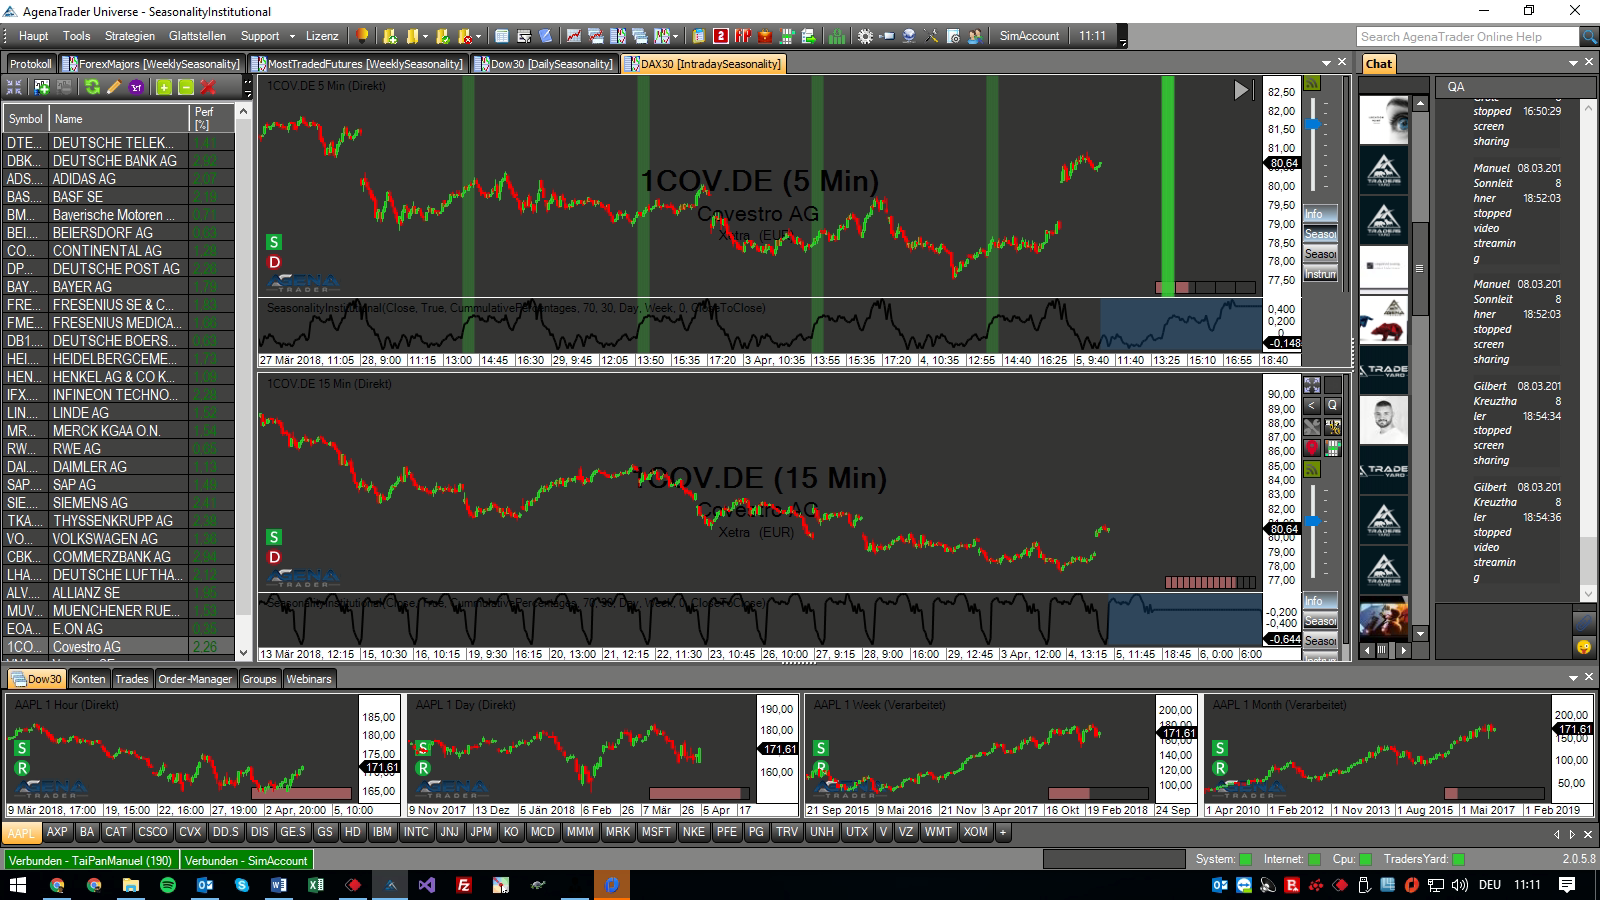
- Calculation of the seasonality for every available instrument that your data feed delivers in AgenaTrader (on an EoD basis and many intraday-charts)
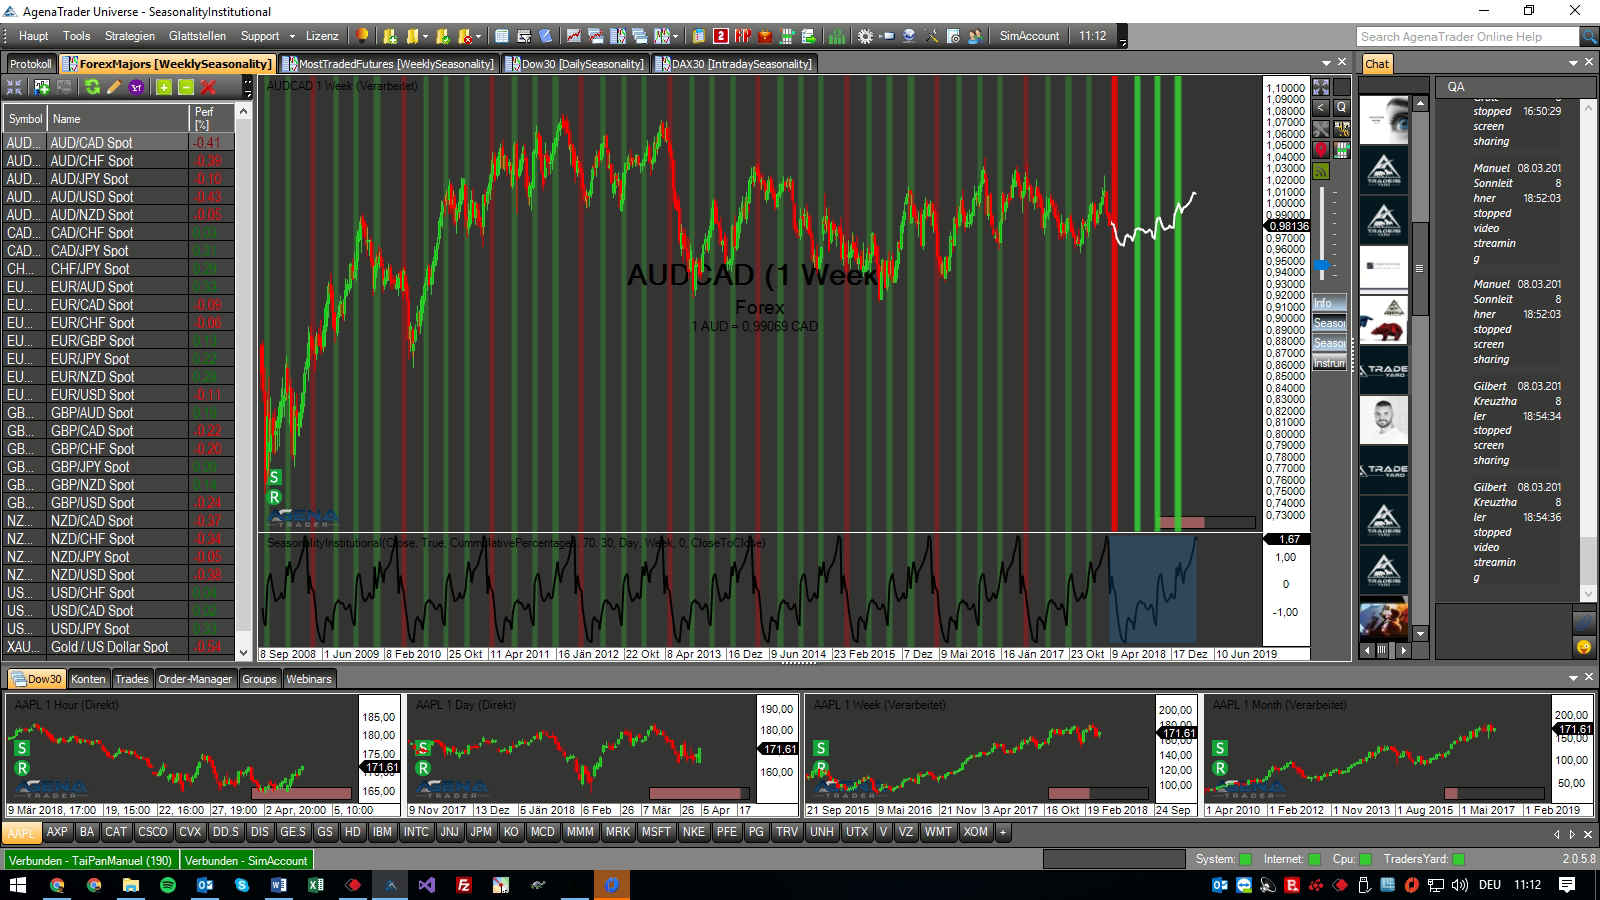
- Identify seasonal run clusters in the chart, where an upward or downward movement can be expected with especially high seasonal probability
- Innovative display of the predicted seasonal pattern directly in the price chart above the SeasonalityPredictor
- Detect over- and underperformers using the InstrumentStrength indicator
- Scan for the best day of a week for buying/selling a financial instrument
- Calculate the expected performance for a specific number of days in the future, based on the seasonality
The seasonality indicator calculates the seasonality in all EndOfDay timeframes (e.g. daily, weekly or monthly chart) as well as many intraday-charts (1-6 Minutes, 10Minutes, 12Minutes, 15Minutes, 30Minutes, 1Hour) using the entire history available in the chart. In addition, using the SeasonalityPredictor, you can have the seasonal pattern projected into the future and view it directly in the chart, so as to see at a glance where the value is most likely to move from a statistical point of view.
The InstrumentStrength indicator is an additional helpful tool that provides you with the possibility to compare the performance of up to 30 instruments with each other in order to efficiently search for over- and underperformers and find optimum candidates for seasonality trades.
The InstrumentDayAnalyzer can tell you, which day of the week is the statistically best for buying/selling a specific financial instrument.
Eventually, you can use the Hold<N>Days indicator to predict the performances which can be expected for a specific number of days in the future, based on the seasonality.
Rental products are automatically extended by the rental period!
With the offer “Rent instead of buying”, you can use AgenaTrader/AddOns as long as you like.
This increases liquidity and also creates flexibility.
Of course, this comes with the full extent of function and authorization for all future software
updates.
Info:
The lease is automatically extended by the respective time period unless an email is sent to and received by [email protected] within 7 days, or the rent is canceled via the user area in the shop itself. Leases that have already been paid for cannot be credited towards a later purchase of AgenaTrader.
Rental upgrades:
For an upgrade to a higher version, the existing rental product must be cancelled and you must make a new subscription to the next higher version. Please send us an email to [email protected], and you will receive access for carrying out the upgrade. After completing the payment, you will receive a new license key.
Related products
-
-
Advanced Volume Analysis
- €19,00 monthly
-
-
-
DowTheory
Analysis- €19,00 monthly
-
-

-
Commitment of Traders
Analysis- €19,00 monthly
-